TradingKey - Robinhood CEO dumps 370,000 shares, cashing in over $40 million and nearly wiping out his direct Class A holdings—does this signal the stock price has peaked?
On October 8, Eastern Time, Robinhood (HOOD) stock continued to weaken after opening, falling from near a high of $110 down to a low of $105, hitting a new low since mid-September. Subsequently, Robinhood's stock price rebounded and strengthened, narrowing its decline to 2.28% and closing at $107.01.
The direct cause of Robinhood's stock price decline was panic commentary in market communities alleging that the CEO was dumping all his holdings. According to disclosures published by the U.S. SEC yesterday, Robinhood CEO Vladimir Tenev sold over 370,000 shares of company stock at a high average price of $114 per share this Monday (October 5), securing $42 million in cash. Crucially, after this transaction was completed, his direct shareholding dropped to fewer than 7,000 shares.
However, looking at the equity structure and trading mechanisms in the SEC filings, this represents a market overinterpretation and an unjustified sell-off of the stock. Vladimir Tenev sold Class A shares, while his Class B super-voting power remains completely untouched. It is reported that Tenev and co-founder Baiju Bhatt still firmly control over 60% of the voting power and actual corporate control through Class B shares.
It should be emphasized that Vladimir Tenev's sale was an executive financial and tax planning transaction scheduled months in advance under Rule 10b5-1, rather than a sudden sell-off driven by a turn in the CEO's outlook on company fundamentals. In addition, Tenev still indirectly holds Class A shares through a family trust and holds a large volume of unvested equity awards and stock options.
Although executive cash-outs bring short-term psychological pressure, whether HOOD's stock price has peaked keyly depends on fundamental factors, including operational and financial performance, as well as cryptocurrency and 24/7 trading businesses, none of which have currently deteriorated. Benefiting from high BTC/ETH trading volumes, Solana ETF capital inflows, and the expansion of cross-chain/Layer-2 ecosystems, retail trading activity remains at historic highs. Furthermore, Robinhood's latest quarterly revenue topped $1.31 billion with an EPS of $0.62, both significantly beating Wall Street expectations.
From a technical analysis perspective, Robinhood failed twice in September to push above $130, and both pullbacks broke below the 0.236 Fibonacci support level. However, it did not break through the corresponding 0.382 key Fibonacci support level, which happens to be the psychological threshold of $100. Before the next earnings report is released (expected on October 27), Robinhood's stock price is more likely to fluctuate widely within the $100–$130 range.
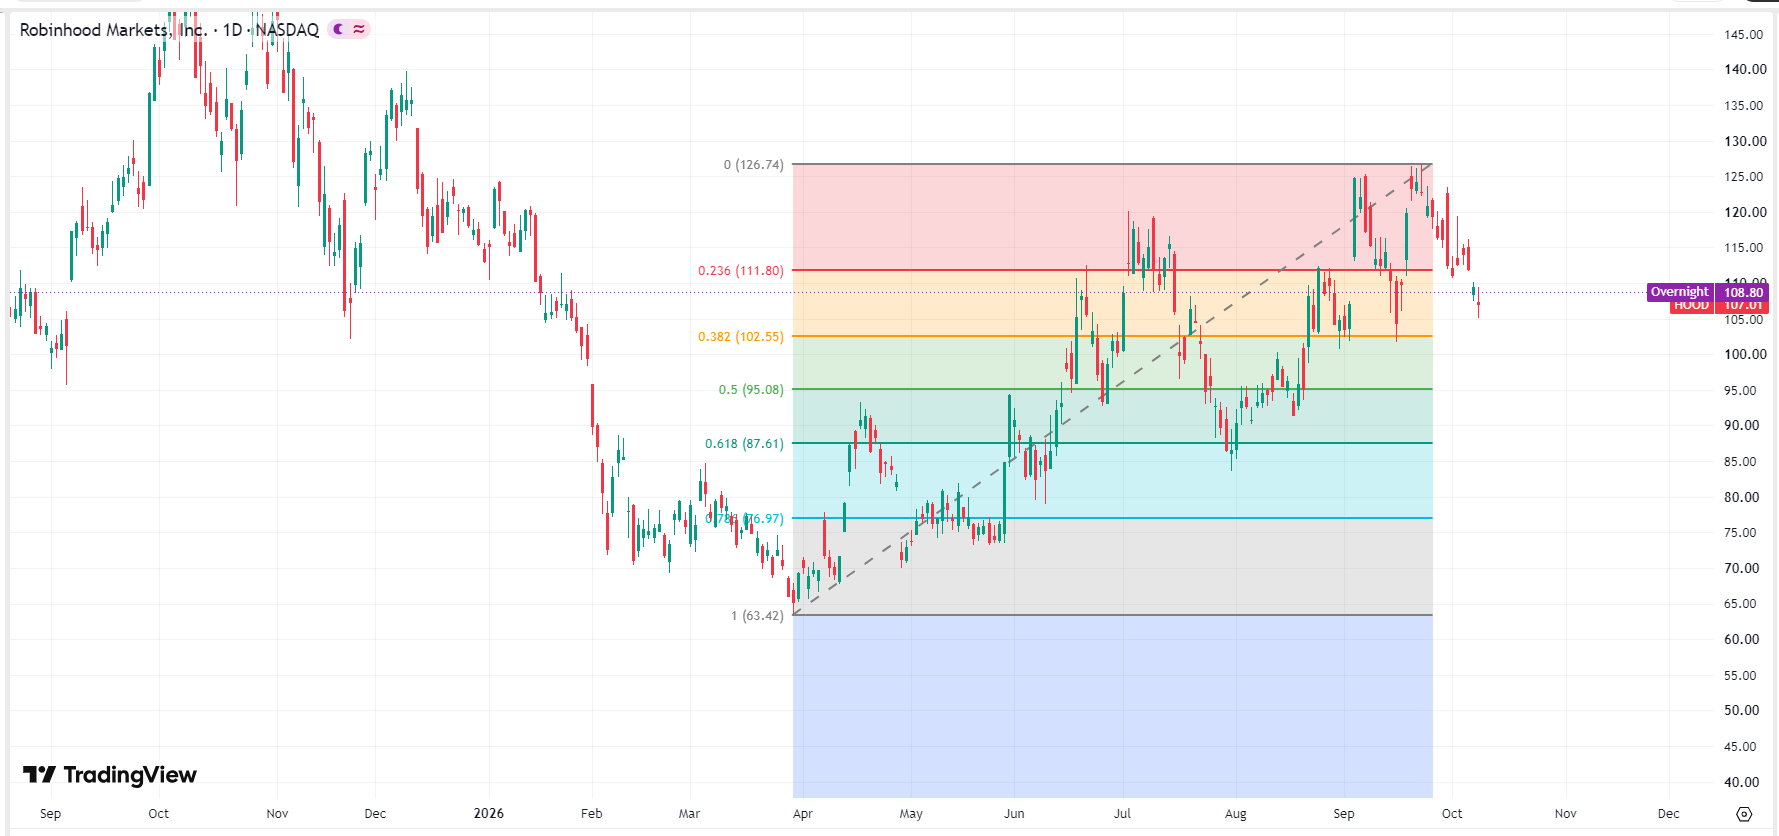 Robinhood stock chart, source: TradingView
Find out more