TradingKey - Crude oil prices remained firm at elevated levels, with Brent crude (UKOIL) trading at $104.43, as negotiations between the U.S. and Iran currently remain at the stage of exchanging proposals, with no ceasefire or peace agreement yet reached.
The trajectory of oil prices remains unresolved. Signals from the U.S. regarding the de-escalation of the conflict with Iran and an increase in diesel supply have put downward pressure on oil prices, while attacks on Middle Eastern infrastructure and tight tanker capacity continue to support the supply risk premium. The future direction of oil prices will depend on whether policy commitments and actual supply improvements can be delivered in tandem.
US Pauses Attack on Iran, Russia Plans to Increase Diesel Supply
U.S. President Donald Trump stated that the U.S. will not attack Iran prior to the November 3 midterm elections, describing discussions with Tehran as "productive." If negotiations lower the probability of conflict escalation, the geopolitical risk premium in oil prices may recede. However, the U.S. maritime blockade of Iran will continue, and supply risks have not been resolved.
In addition, Trump stated that Russia will supply additional diesel to the U.S. and global markets in batches, and the U.S. Department of the Treasury will immediately issue temporary general licenses. If the deliveries materialize, it is expected to ease diesel shortages and price pressures, posing an indirect bearish drag on the crude oil market. However, a license does not equate to actual delivery, and subsequent additional supplies will also depend on the status of Russian refineries.
Energy Facilities Attacked, Inefficient Transfers Squeeze Tanker Capacity
On the other hand, the Houthi movement is attacking Saudi energy and other infrastructure, raising the risk of production and transport disruptions. Amrita Sen, founder of Energy Aspects, believes the futures market underestimates the impact of the conflict on the ground and that prices for some physical crude should be close to $150 per barrel. This is her assessment for certain physical crudes, not a target price for crude futures.
Shipping bottlenecks are also worsening. To lower the risk of transiting the Strait of Hormuz, some exported crude must be delivered via shuttle transport and ship-to-ship transfers, occupying more tankers and squeezing available capacity on other shipping routes.
On October 7, supertanker freight rates from the Persian Gulf to East Asia rose to nearly $1.4 million per day, up about 540% from pre-conflict levels. High freight rates initially push up the landed cost of crude oil; if transport bottlenecks continue to limit arrivals, they may also support spot prices and supply risk premiums.
In the short term, diplomatic de-escalation and expectations of increased diesel supply may weigh on oil prices; however, if infrastructure damage and shipping disruptions do not ease, physical supply pressures could still drive a price rebound.
Brent Crude Technical Analysis
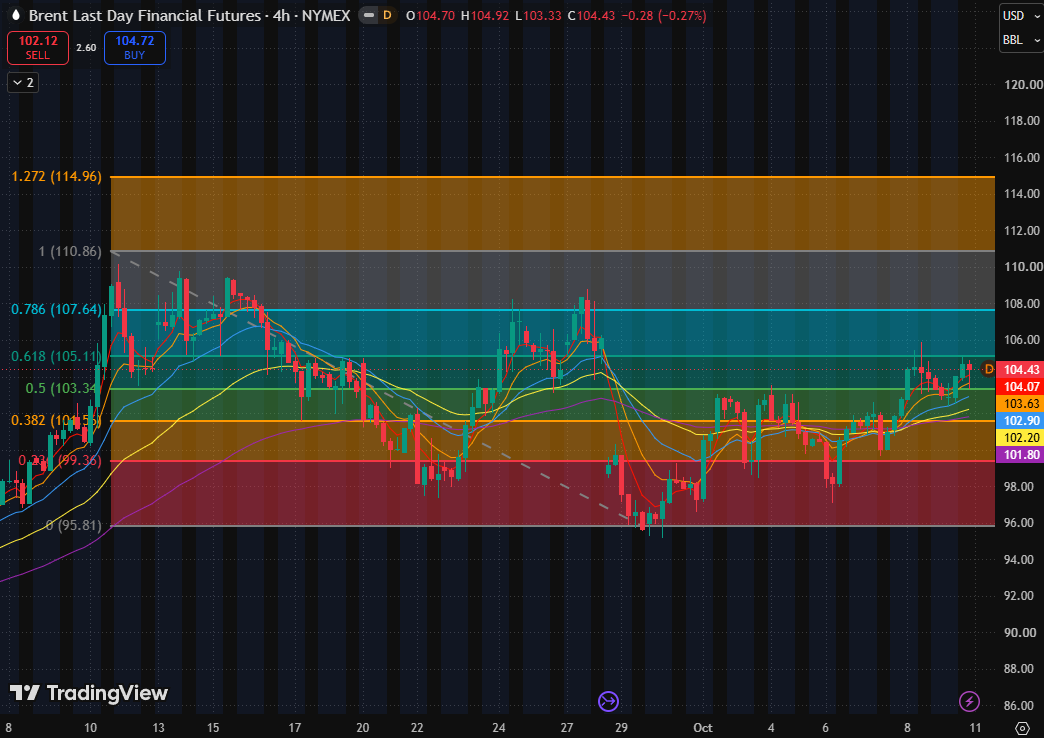
Brent crude oil price 4-hour candlestick chart, Source: TradingView
Looking at the Brent 4-hour candlestick chart, the price is positioned between support at $103.34 and resistance at $105.11, currently forming a pattern of retesting and pushing higher following an in-range rebound. The short-term trend is relatively strong, but it has not yet broken above key overhead resistance, so a new round of upside cannot be confirmed based on this alone.
Judging from the chart, oil prices have rebounded from late-September lows, with recent pullback lows gradually rising, improving the short-term rebound structure. However, the price remains inside the previous wide trading range, still some distance from earlier highs, making it more appropriate to define the current move as an in-range repair.
Regarding moving averages, the 5-day, 10-day, 20-day, 80-day, and 160-day moving averages are ordered from top to bottom, with the price sitting above all moving averages, displaying a fully bullish alignment. Among these, the 5-day moving average is at $104.07, and the 20-day moving average is at $102.90. Short-term moving averages are sloping upward, providing support for the rebound.
Regarding upside potential, the rebound can only continue upward if the 4-hour candlestick closes firmly above $105.11, and close attention should be paid to whether US-Iran geopolitical tensions trend toward escalation.
Regarding downside risk, if $103.34 is lost and cannot be reclaimed, the thesis of buying support on this pullback will weaken. Prices may then seek support in the zone between the 160-day moving average ($101.80) and the 80-day moving average ($102.20), which sits adjacent to the previous consolidation zone around $101 to $102. A retreat to this region would imply that short-term momentum has cooled significantly, necessitating a reassessment of buying support.
Find out more