TradingKey - Nvidia Shares Rise Nearly 2% to Snap Losing Streak: Is the AI Leader Gearing Up for a New Rally?
On October 9, Nvidia (NVDA) shares rebounded nearly 2% in pre-market trading to $234.27, snapping a three-consecutive-day losing streak and recouping part of the losses. However, does today's rebound mark the official start of a new primary rally, or is it merely a technical correction and position turnover within a high-level consolidation?
On Tuesday this week (October 6), Nvidia's stock price surged to $243 intraday, setting another record high. Subsequently, the stock pulled back after surging, with losses expanding yesterday due to a pullback in the broader U.S. market, falling nearly 3% in a single day to $230.48.
However, as Nvidia's fundamentals suffered no material deterioration, dip-buying capital quickly stepped in. Among the key drivers, core foundry partner TSMC (TSM) continued to achieve record revenue, strongly confirming robust demand momentum for GPUs based on the Blackwell and Hopper architectures and dispelling market concerns over short-term delays in advanced packaging shipments.
In addition, market concerns over HBM3e supply caused by an earlier labor dispute at Micron's (MU) Taiwan plant were subsequently eased after Wall Street firms such as Cantor Fitzgerald stated that HBM supply shortages and strong pricing power remained unchanged; shares of Micron and SK Hynix rebounded, boosting investment sentiment across Nvidia's hardware ecosystem.
Nvidia's forward P/E currently stands at around 29x, which remains highly attractive compared to its revenue growth rate of over 100%. In addition, the share buyback program authorized by the company's board provides strong downside protection. However, Nvidia has accumulated previous trapped overhead supply near $240. To confirm a new wave of gains, the daily candlestick must close above the all-time high of $243.37 on heavy volume.
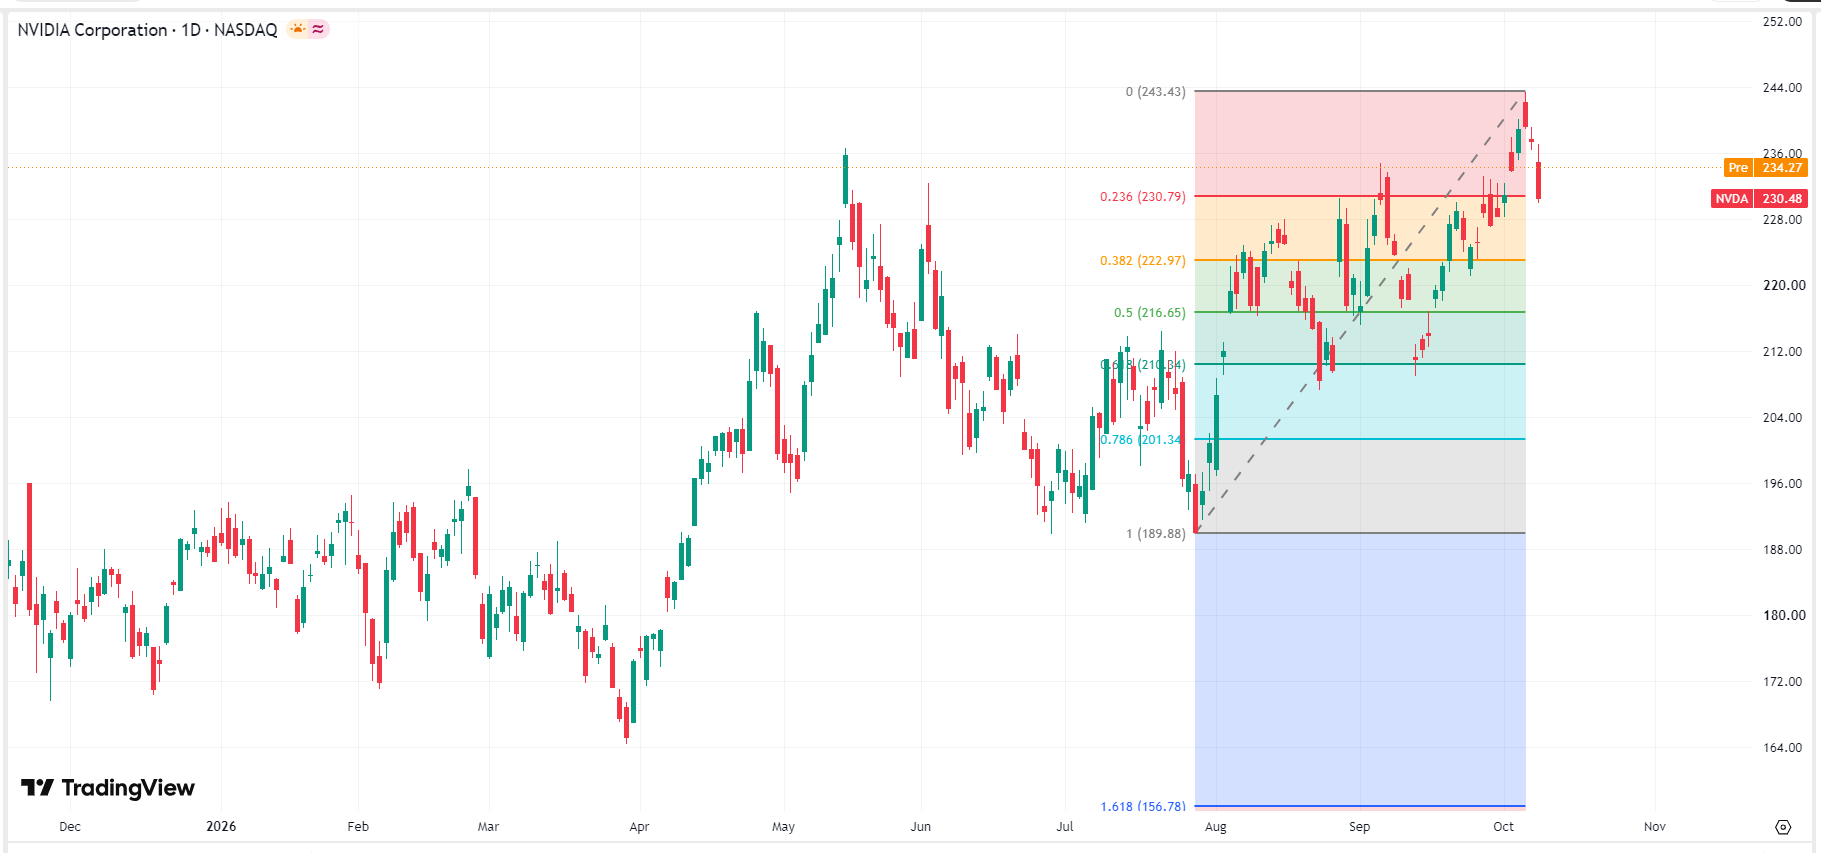 Nvidia stock price chart, Source: TradingView
Currently, Nvidia's stock price remains in a testing phase of high-level box consolidation. $230 represents the monthly moving average and a dense trading platform, as well as a short-term battleground between bulls and bears. A more critical line of defense lies at $220.00–$221.39, which is strong 50-day support. If this level fails to hold, it would mean that the medium-to-long-term bullish structure has been broken.
Find out more