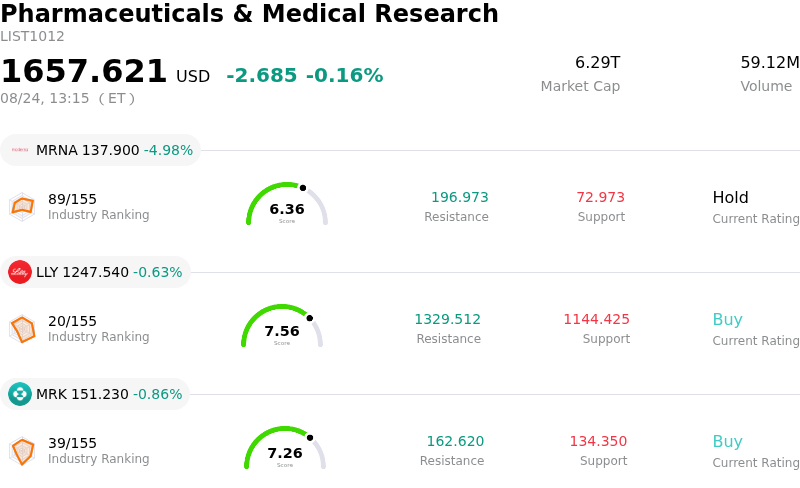
Tempus AI Inc (TEM) moved down by 7.10%. The Pharmaceuticals & Medical Research sector is down by 0.16%. The company underperformed the industry. Top 3 stocks by turnover in the sector: Moderna Inc (MRNA) down 4.98%; Eli Lilly and Co (LLY) down 0.63%; Merck & Co Inc (MRK) down 0.86%.
What is driving Tempus AI Inc (TEM)’s stock price down today?
Tempus AI experienced a notable downturn as profit-taking swept through the shares following a major multi-day rally. The weakness unfolded despite positive regulatory momentum, as the company announced FDA 510(k) clearance for its artificial intelligence software designed to detect indicators of pulmonary hypertension from standard electrocardiograms. While this clearance represents a key expansion of the company's diagnostic AI portfolio, the market reaction exemplified a classic sell-the-news response. Capitalizing on the positive announcement, market participants locked in substantial gains accumulated during the stock's recent steep advance, which had been driven by optimism surrounding its planned acquisition of Personalis and positive developments in precision oncology.
From a technical perspective, the retracement was exacerbated by severely overbought conditions. Leading into the trading session, technical metrics including relative strength indicators and Bollinger Band deviations signaled that the stock was heavily extended relative to its short-term moving averages. This technical overextension naturally invited selling pressure as short-term traders unwound long positions. Compounding the technical setup are ongoing valuation debates. While long-term discounted cash flow models point to underlying growth potential, the company continues to carry an elevated price-to-sales multiple against a backdrop of unprofitability, leaving the stock vulnerable to sharp pullbacks whenever momentum stalls.
Sentiment was further tempered by recent regulatory filings detailing insider share sales by corporate officers. Although these transactions were executed under pre-scheduled Rule 10b5-1 trading plans and mandatory sell-to-cover tax obligations, public disclosures of insider selling frequently add incremental friction to stock sentiment during periods of heightened volatility. Looking ahead, institutional investors will likely focus on the company's execution in integrating its strategic acquisitions and commercializing its growing suite of regulatory-cleared diagnostic tools, balancing high-growth opportunities in healthcare artificial intelligence against execution risks and valuation discipline.
Technical Analysis of Tempus AI Inc (TEM)
Technically, Tempus AI Inc (TEM) shows a MACD (12,26,9) value of 4.668, indicating a buy signal. The RSI at 65.959 suggests neutral condition and the Williams %R at 19.389 suggests overbought condition. Please monitor closely.
Fundamental Analysis of Tempus AI Inc (TEM)
Tempus AI Inc (TEM) is in the Pharmaceuticals & Medical Research industry. Its latest annual revenue is $1.27B, ranking 17 in the industry. The net profit is $-245.03M, ranking 573 in the industry. Company Profile
Over the past month, multiple analysts have rated the company as Buy, with an average price target of $64.68, a high of $100.00, and a low of $35.00.
More details about Tempus AI Inc (TEM)
Company Specific Risks:
- Dilution and Integration Risks from $1.5B Personalis Acquisition: The stock-funded acquisition of Personalis for approximately $1.5 billion exposes existing shareholders to equity dilution and significant execution risks at an elevated valuation multiple (~15.5x EV/sales), alongside legal scrutiny regarding potential prior conflicts of interest.
- Widespread Executive Insider Selling: SEC Form 4 and Rule 144 filings over recent sessions disclosed significant share liquidations by top executives—including the Chief Financial Officer, Chief Legal Officer, and Diagnostics CEO—totaling tens of thousands of shares sold without any insider purchases over the past six months.
- Elevated Valuation and Negative Free Cash Flow Deficit: Despite top-line momentum, the company trades at a rich Price-to-Sales multiple of roughly 8.6x alongside a high debt-to-equity ratio of 3.25, while continuing to generate substantial negative free cash flow outflows exceeding $270 million over the trailing twelve months.
- Elevated Short Interest and Intraday Volatility: With short interest representing over 33% of the public float, the stock faces persistent downside volatility and intraday sell-offs as traders take profits following rapid news-driven rallies.
Find out more